Introduction
The data analytics screen displays a sales data dashboard, which you can use to manage the sales strategy for each sales representative.
How it fits together
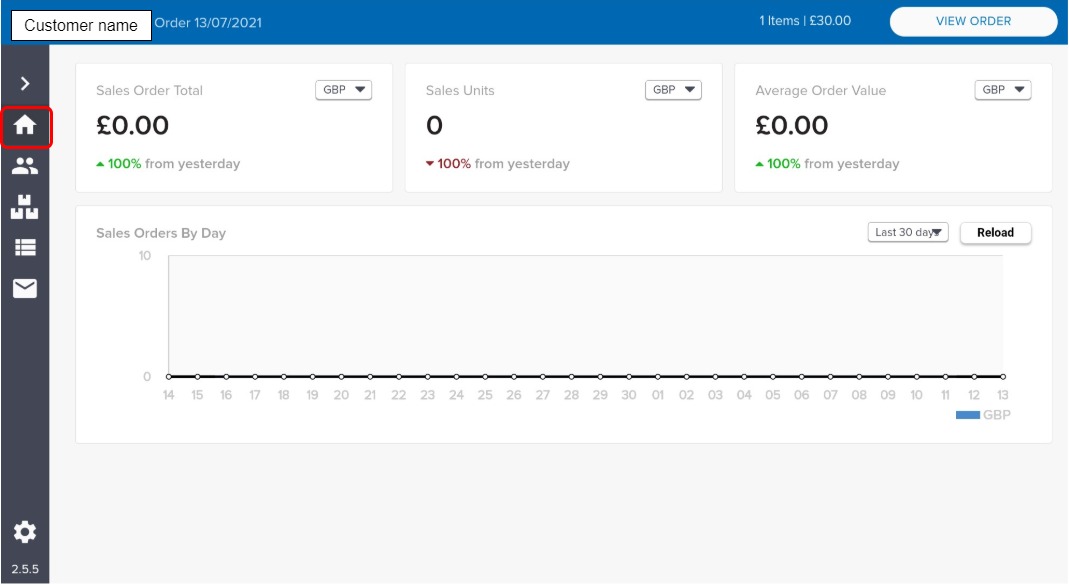
The data analytics screen displays a sales data dashboard, containing four data sets:
-
Sales order by day - filter by time period or reload at any time
-
Average order value - filter by currency or view change from the previous day
-
Sales units - filter by currency or view change from the previous day
-
Sales order total - filter by currency or view change from the previous day
Actions available
-
Customize the look and feel of your dashboard, by moving the information panels around to create the look that works for you,
-
view the sales data.
Key points
Data displayed is based on orders processed by the sales representative using this device.