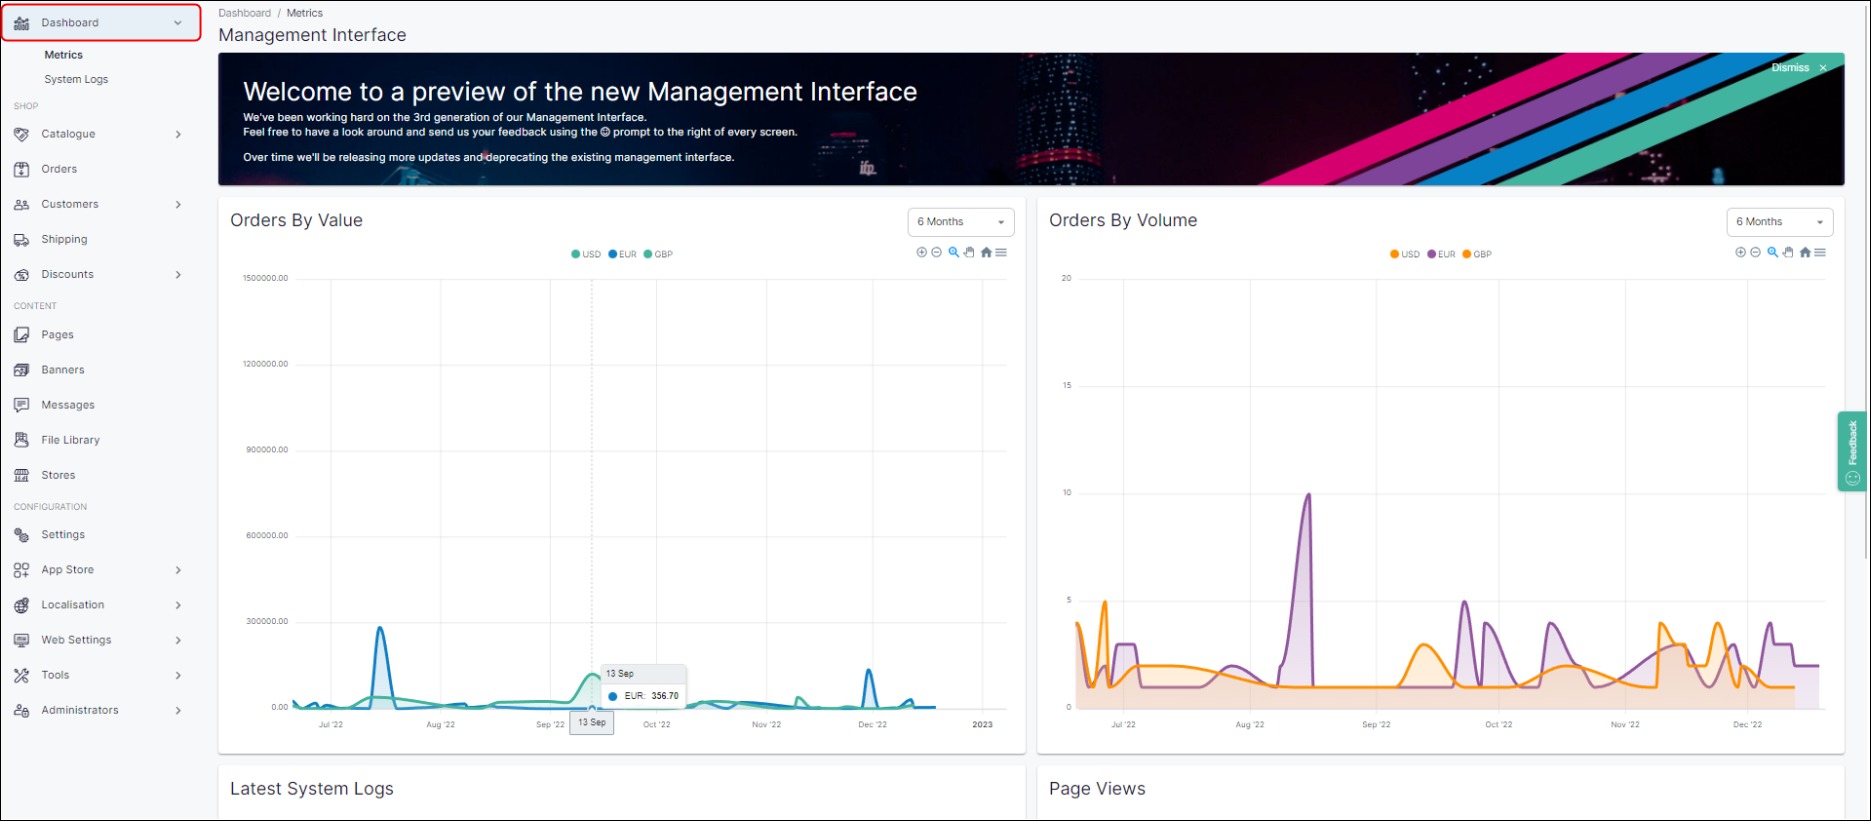
Screen layout: Dashboard
Introduction
The Dashboard screen displays analytics on how your system is used.
How it fits together
The Dashboard screens displays data analytics that provide insights you can use to inform your sales strategy and manage the day to day operation of your Digital Commerce system. By default, the Dashboard screen is displayed when you log into Management Interface.

Sales data
Sales data is retrieved and displayed on two information panels: Order by values and Orders by volume.
Actions available
Filter each dataset by date range and/or currency
Zoom in or out of each graph
Pan the available data
Download each graph in SVG or PNG format
Display all data
System data
System data is retrieved and displayed on two information panels: Latest System Logs and Page Views.
Actions available
View the latest system logs which lists information about system heartbeats, data imports and refreshes.
View page view analytics to obtain insights into your customer’s user experience.
